Transforming Business Strategies through Visual Data Insights: Enhance Decision-Making with Data Visualization
Enhance decision-making with data visualization—this concept has become a linchpin in modern business strategy, providing an essential tool for business executives, mid-level managers, and entrepreneurs. This article offers an authoritative overview of how data visualization is transforming decision-making processes in businesses, touching on key areas such as change management, executive coaching, and management consulting.
The Power of Data Visualization in Business
Data visualization stands at the intersection of art and science, serving as a powerful tool that transforms raw data into graphical formats that are not only visually appealing but also easy to comprehend and interpret. Its significance in the business world cannot be overstated, especially in an era where data is continuously generated at an unprecedented scale. Data visualization simplifies complex datasets, making it possible for business leaders and decision-makers to quickly grasp intricate concepts, trends, and relationships that would be challenging to understand in their raw, numeric form.
One of the primary benefits of data visualization is its ability to highlight new patterns and connections that might go unnoticed in traditional, text-heavy reports. By presenting data in formats like charts, graphs, heat maps, and infographics, it brings forward subtle details, outliers, and anomalies, offering insights that could be crucial for strategic planning and decision-making. This aspect is particularly valuable in scenarios where decisions need to be made rapidly and on the basis of the latest information.
Moreover, visual data representation facilitates the efficient processing of large volumes of information. In today’s fast-paced business environment, where time is a critical resource, the ability to quickly digest and act on information can provide a competitive edge. Data visualization tools enable leaders to absorb essential data points at a glance, making it possible to respond to market changes swiftly and with a higher degree of confidence.
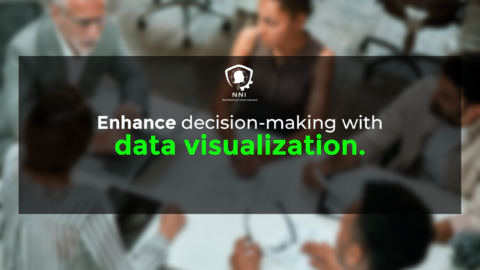
Another key advantage of data visualization is in its capacity to enhance communication and storytelling with data. When presenting complex data sets to stakeholders, employees, or clients, visualization makes the information more accessible and engaging. It turns abstract numbers into compelling narratives that can persuade and inform. This is particularly important in meetings and presentations where understanding and buy-in from diverse groups are necessary.
Furthermore, data visualization supports cross-departmental collaboration within an organization. By providing a common visual language, it bridges the gap between different specializations and departments, enhancing teamwork and collaborative analysis. This unified approach is crucial for developing comprehensive strategies that consider various aspects of the business.
In summary, data visualization is a vital component of modern data analysis and business intelligence. It not only aids in making more informed and faster decisions but also enhances communication, collaboration, and strategic planning. As businesses continue to navigate large and complex datasets, the role of data visualization in facilitating a deeper understanding and more effective use of this data becomes increasingly important.
Improving Clarity and Engagement
Visual representations such as charts, graphs, and infographics provide clarity that cannot be achieved through numbers and text alone. They engage the viewer, making it easier to digest information, which is particularly beneficial in executive presentations and stakeholder meetings.
Integrating Data Visualization in Change Management
Change management in organizations often involves dealing with complex information and data. Data visualization tools can play a pivotal role in communicating these complexities in a more digestible format. They can illustrate the need for change, the potential impact of different strategies, and the progress of ongoing change initiatives.
Executive Coaching for Effective Visualization Skills
Executive coaching services are increasingly focusing on enhancing leaders’ ability to use data visualization effectively. This includes training on selecting the right type of visualization, interpreting data accurately, and using visual tools to communicate strategic decisions persuasively.
The Role of Generative AI in Data Visualization
Generative Artificial Intelligence (AI) is revolutionizing the field of data visualization. AI algorithms can analyze large datasets and automatically generate visual representations, uncovering insights that might be missed by human analysts. This can significantly enhance the decision-making process, providing a competitive edge in the business landscape.
Advanced Analytics for Strategic Business Insights
Generative AI facilitates advanced analytics, which can predict trends, model business scenarios, and provide strategic insights. This ability is invaluable for leaders in formulating long-term business strategies and responding to market changes.
Project Management and Visualization Tools
In project management, data visualization tools are essential for monitoring project progress, resource allocation, and risk assessment. These tools provide a clear overview of the project’s status, helping managers to make proactive decisions and keep the project on track.
In conclusion, enhancing decision-making with data visualization is a critical strategy for businesses seeking to navigate the complexities of the modern market. By leveraging these tools, organizations can gain deeper insights, communicate more effectively, and make more informed strategic decisions.
#DataVisualization, #BusinessStrategy, #DecisionMaking, #ManagementConsulting
Related posts:
 Enhance Decision-Making with Data Visualization: A Strategic Imperative
 Unify global financials and operations to empower decision-making: Empowering Decision-Making in Business
 Drive Timely Decision-Making with Streaming Business Analytics
 Empowering Decision-Making: Unify global financials and operations